IC Markets Home Sign in Web Trader Contact Us
IC Markets Social IC Markets Social

Information Hub for
Serious Traders

  • ABOUT US
  • OPEN LIVE ACCOUNT
  • OPEN DEMO ACCOUNT
  • TRADE NOW
  • VISIT OUR BLOG
IC Markets Social
  • ABOUT US
  • OPEN LIVE ACCOUNT
  • OPEN DEMO ACCOUNT
  • TRADE NOW
  • VISIT OUR BLOG
August 24, 2023North_American_Stocks_esIC Markets

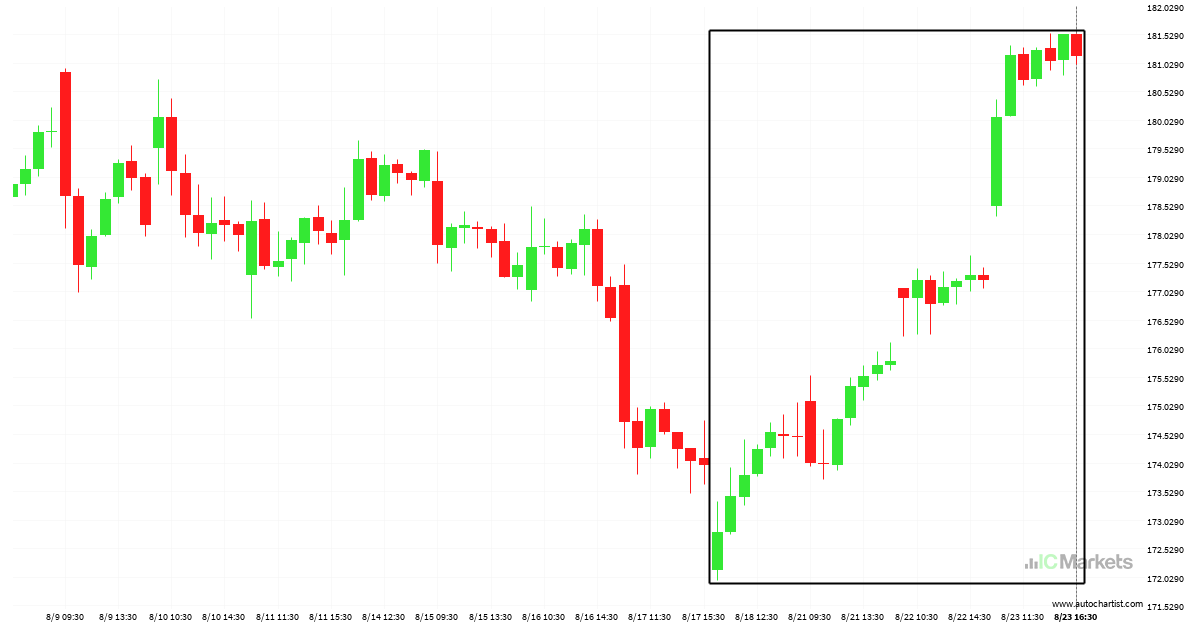
Extraordinario movimiento alcista del Apple Inc.

El Apple Inc. ha ascendido un 4,82% de 172.81 a 181.14 en 6 días.

Read more
August 23, 2023North_American_Stocks_esIC Markets

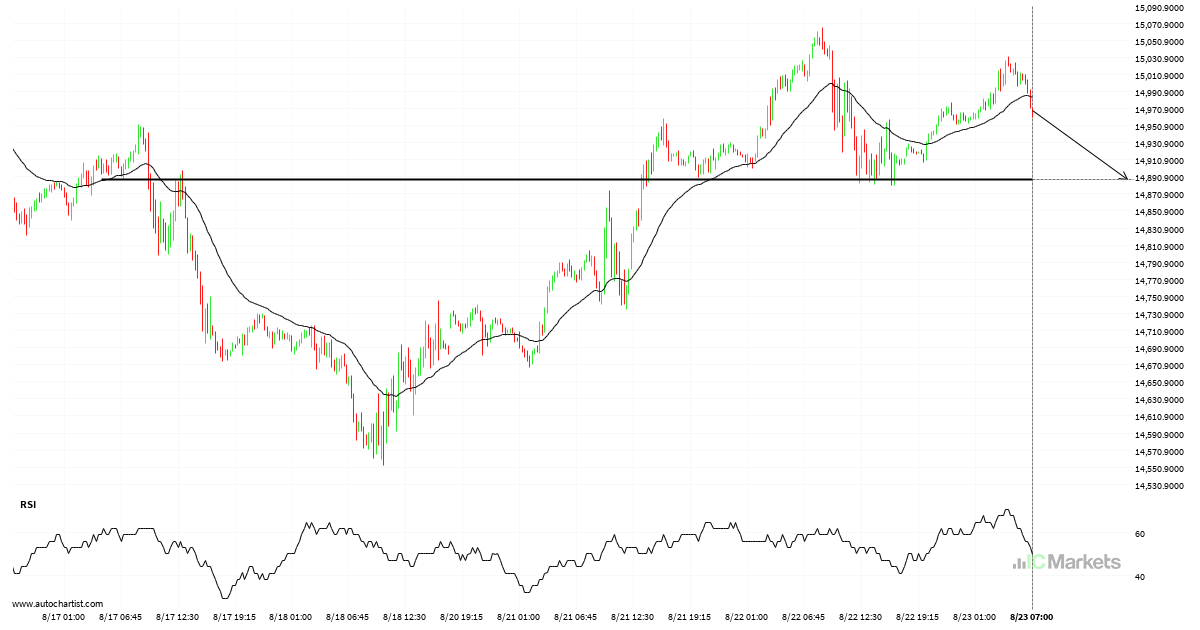
US Tech 100 Index – se acerca a la línea de precio psicológico

El US Tech 100 Index avanza hacia la línea de soporte de un Soporte. Como lo hemos observado retrocediendo desde este nivel en el pasado, podríamos observar, o bien una ruptura a través de esta línea o una recuperación de nuevo a los niveles actuales. Ya ha llegado a dicha línea en numerosas ocasiones durante […]

Read more
August 22, 2023North_American_Stocks_esIC Markets

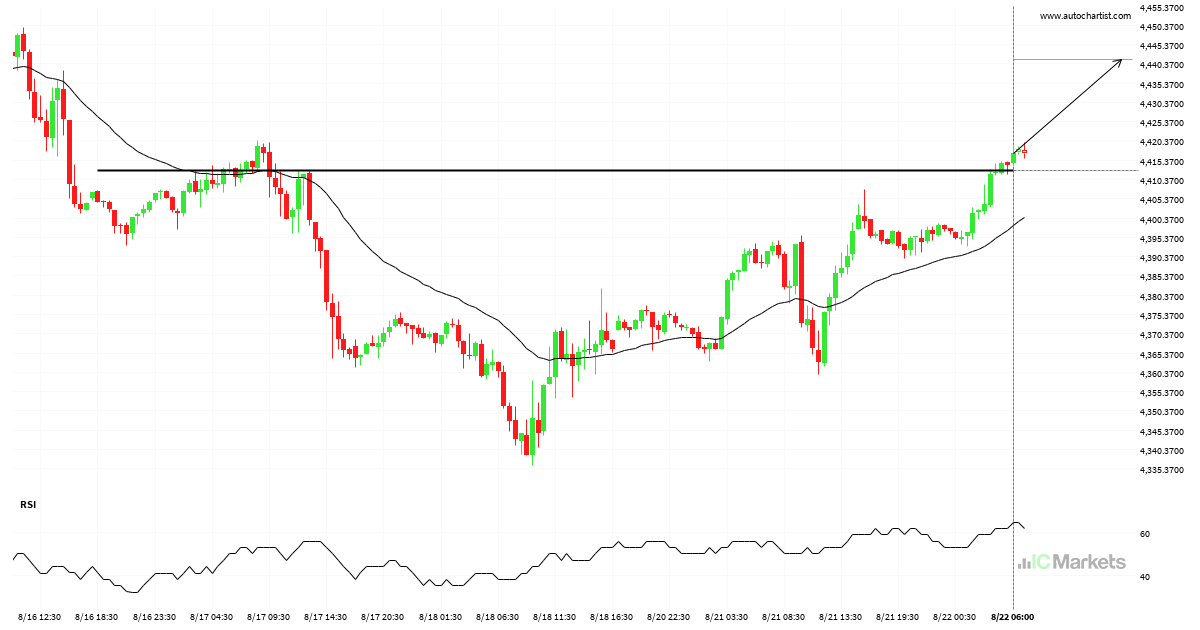
El US SPX 500 Index atravesó la importante línea de precio de 4412.7002

El US SPX 500 Index atravesó una línea de resistencia. Ha entrado en contacto con esta línea en numerosas ocasiones en los últimos 6 días. Esta irrupción muestra un movimiento potencial hacia el nivel de 4441.3999 dentro de las próximas 19 horas. Ya hemos observado un retroceso desde esta posición en el pasado, por tanto, […]

Read more
August 21, 2023North_American_Stocks_esIC Markets

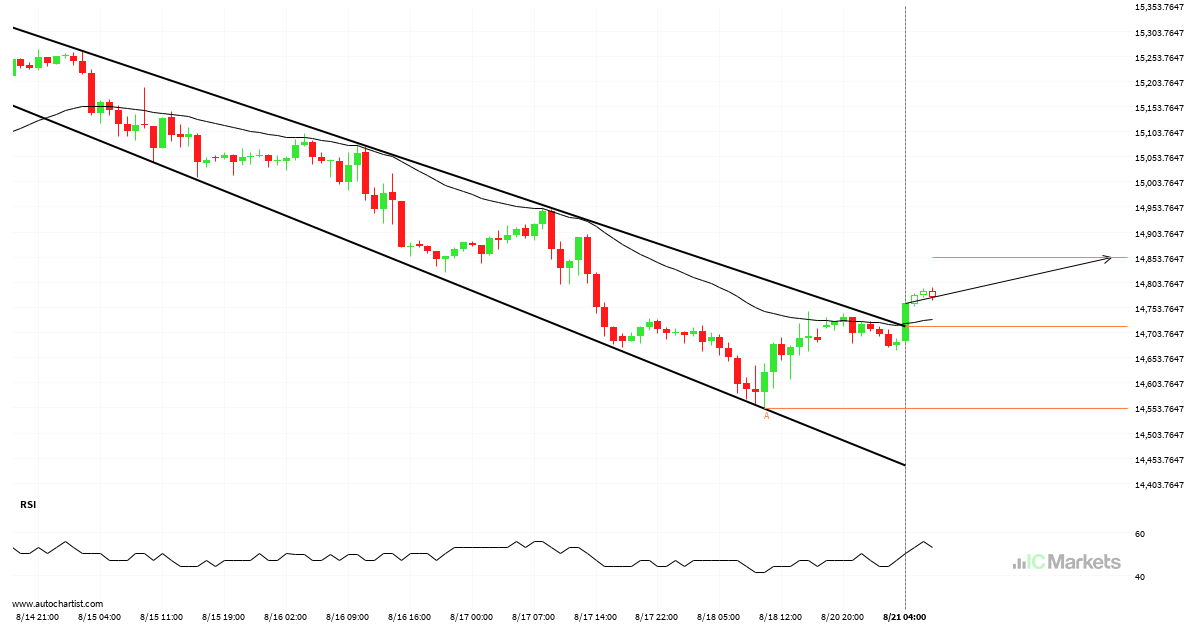
El US Tech 100 Index ha atravesado la resistencia

El US Tech 100 Index atravesó una línea de resistencia. Ha entrado en contacto con esta línea por lo menos dos veces en 7 días. Esta ruptura puede indicar un movimiento potencial a 14852.6569 en 2 días. Como ya vimos un retroceso de esta posición en el pasado, debemos esperar la confirmación de la ruptura […]

Read more
August 18, 2023North_American_Stocks_esIC Markets

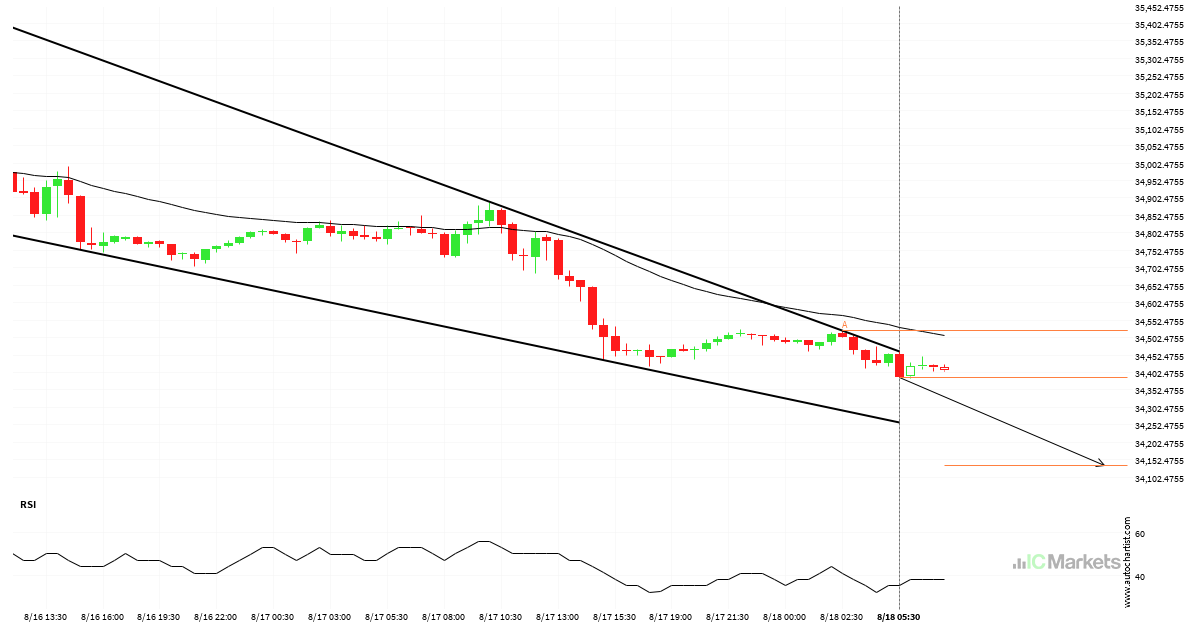
El US Wall Street 30 Index se aproxima a el soporte de un Cuña descendente

El US Wall Street 30 Index se está acercando a la línea de soporte de un Cuña descendente. Ha llegado a esta línea en numerosas ocasiones durante los últimos 2 días. Si vuelve a probarla de nuevo, debería hacerlo en las próximas 10 horas.

Read more
August 17, 2023North_American_Stocks_esIC Markets

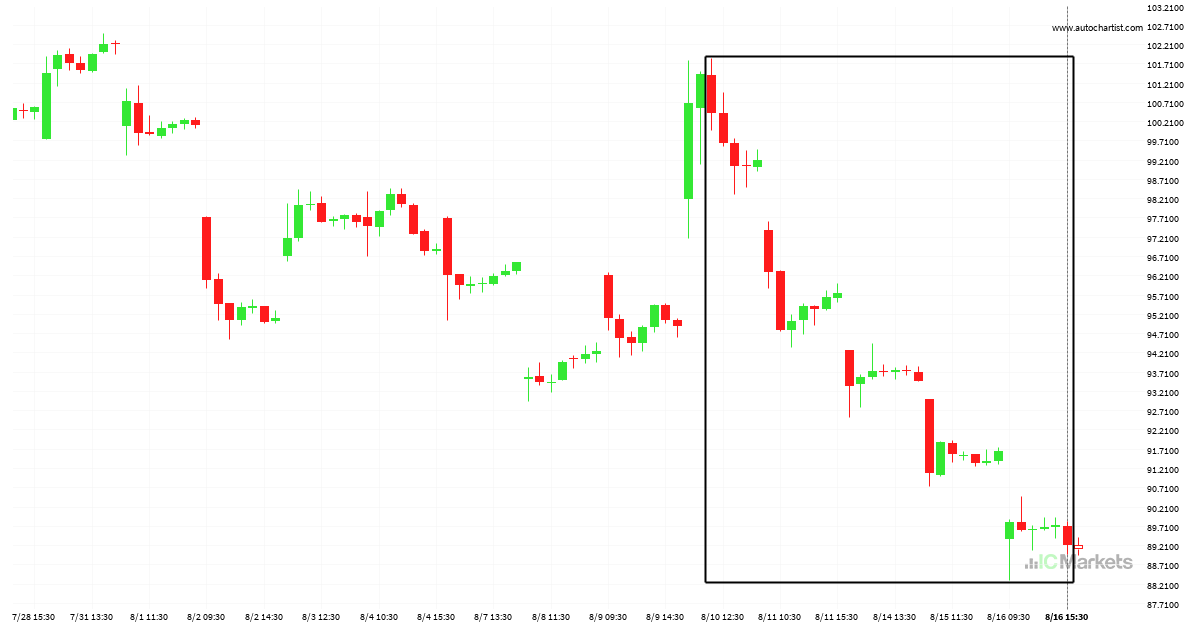
Extraordinario movimiento bajista del Alibaba Group Holding Limited

El Alibaba Group Holding Limited ha descendido un 11,18% de 100.43 a 89.2 en 7 días.

Read more
August 16, 2023North_American_Stocks_esIC Markets

El US Wall Street 30 Index se aproxima a la resistencia de un Canal bajista

El US Wall Street 30 Index se está acercando a la línea de resistencia de un Canal bajista. Ha llegado a esta línea en numerosas ocasiones durante los últimos 7 días. Si vuelve a probarla de nuevo, debería hacerlo en las próximas 2 días.

Read more
August 14, 2023North_American_Stocks_esIC Markets

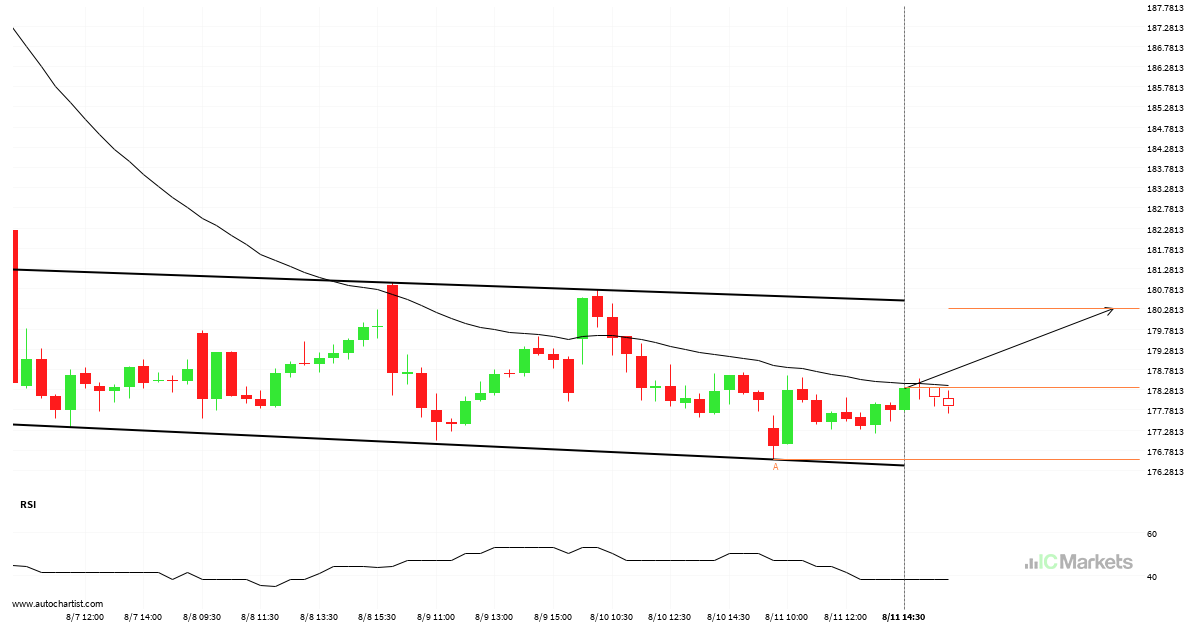
El Apple Inc. se aproxima a la resistencia de un Canal bajista

El Apple Inc. se está acercando a la línea de resistencia de un Canal bajista. Ha llegado a esta línea en numerosas ocasiones durante los últimos 12 días. Si vuelve a probarla de nuevo, debería hacerlo en las próximas 7 horas.

Read more
August 11, 2023North_American_Stocks_esIC Markets

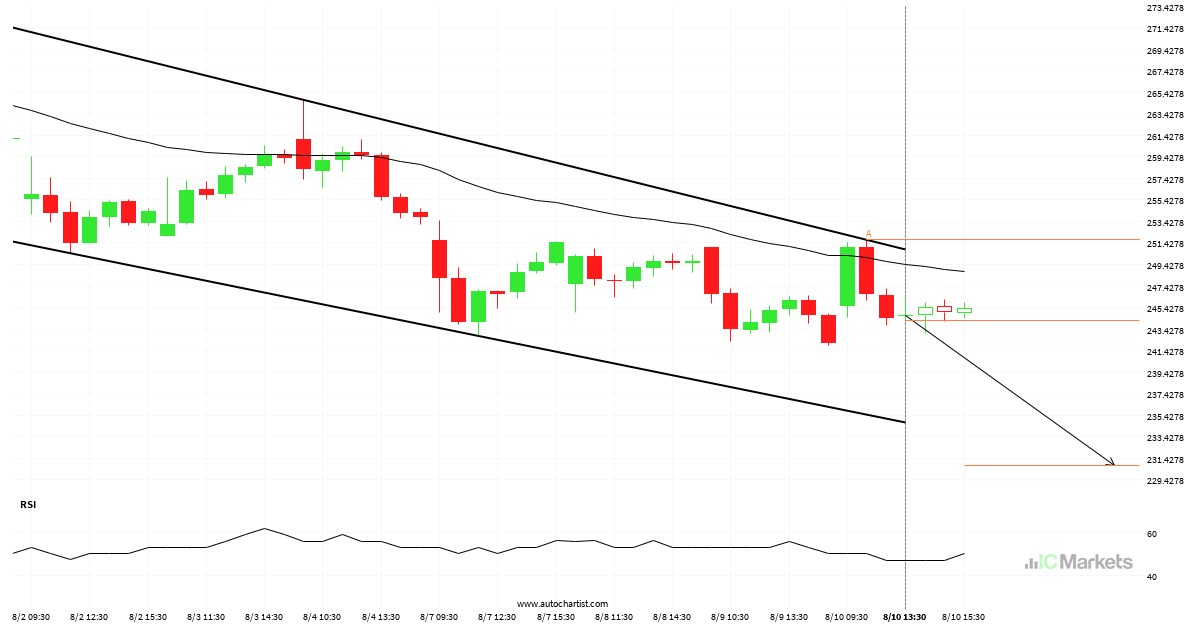
El Tesla Inc. se aproxima a el soporte de un Canal bajista

El Tesla Inc. se está acercando a la línea de soporte de un Canal bajista. Ha llegado a esta línea en numerosas ocasiones durante los últimos 11 días. Si vuelve a probarla de nuevo, debería hacerlo en las próximas 11 horas.

Read more
August 9, 2023North_American_Stocks_esIC Markets

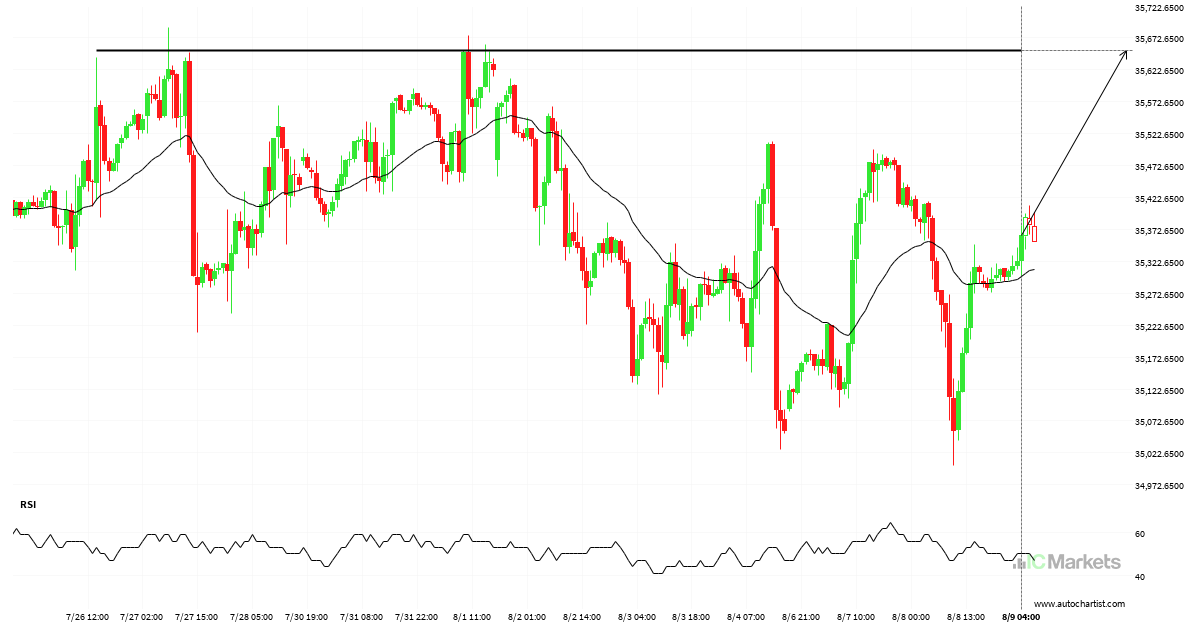
US Wall Street 30 Index – se acerca a la línea de precio psicológico

El US Wall Street 30 Index avanza hacia la línea de resistencia de un Resistencia. Como lo hemos observado retrocediendo desde este nivel en el pasado, podríamos observar, o bien una ruptura a través de esta línea o una recuperación de nuevo a los niveles actuales. Ya ha llegado a dicha línea en numerosas ocasiones […]

Read more
  • 1
  • 2
  • 3
  • …
  • 27
  • 28
  • 29
  • 30
  • 31
  • 32
  • 33
  • …
  • 89
  • 90
  • 91

Recent Posts

  • Either a rebound or a breakout imminent on SILVER
  • GOLD Nível visado: 2976.3601
  • A potential bearish movement on GOLD
  • มีโอกาสเกิดการเคลื่อนตัวแบบ bearish บน GOLD
  • Posible gran movimiento en el AUDJPY

Recent Comments

    Translation


     Edit Translation

    Trade with

    a market leader you can rely on

    Open Trading Account Try a Free Demo

    Forex Trading

    • Accounts Overview
    • Open an Account
    • Launch Web Trader

    Trading Specifications

    • Spreads and Commissions
    • Range of Market
    • Trading Hours
    • Funding
    • Withdrawal

    About IC Markets

    • Help Center
    • Why IC Markets
    • Regulation
    • Legal Documents
    • Contact Us


    Forex Trading

    • Accounts Overview
    • Open an Account
    • Launch Web Trader

    Trading Specifications

    • Spreads and Commissions
    • Range of Market
    • Trading Hours
    • Funding
    • Withdrawal

    About IC Markets

    • Chat with a Specialist 24/7
    • Why IC Markets
    • Regulation
    • Legal Documents
    • Contact Us

    Disclaimer: This material is marketing material where all marketing material is published for informational purposes only. This material does not contain and should not be considered as containing - investment advice and recommendations, or suggestions for performing any actions with financial instruments. The built-in widgets belong to their external independent authors, and IC Markets is not responsible for their content and their impact on trade.

    All content rights reserved. Opinions of the authors may not coincide with the opinion of the blog editors. When copying materials from this site or connecting to an RSS feed to republish our articles, a link to IC Markets or attribution in the format ‘IC Markets Blog’ is required. For general questions, please contact the editorial office via the form on the Contact us page.

    Risk Warning: Trading Derivatives carries a high level of risk to your capital and you should only trade with money you can afford to lose. Trading Derivatives may not be suitable for all investors, so please ensure that you fully understand the risks involved and seek independent advice if necessary. A Product Disclosure Statement (PDS) should be considered before entering into a transaction with us.

    The contents of this page are general information only and does not take into account your personal situation, financial objectives or needs. It is up to you to make sure the products that we offer suit your specific needs. You should not trade with us unless you understand the features and risks of the products that we offer. This means that you might need to seek independent advice before you start trading with us.

    © 2022 Raw Trading Ltd | All rights reserved.
    • Sample Page